

Action Item Analytics
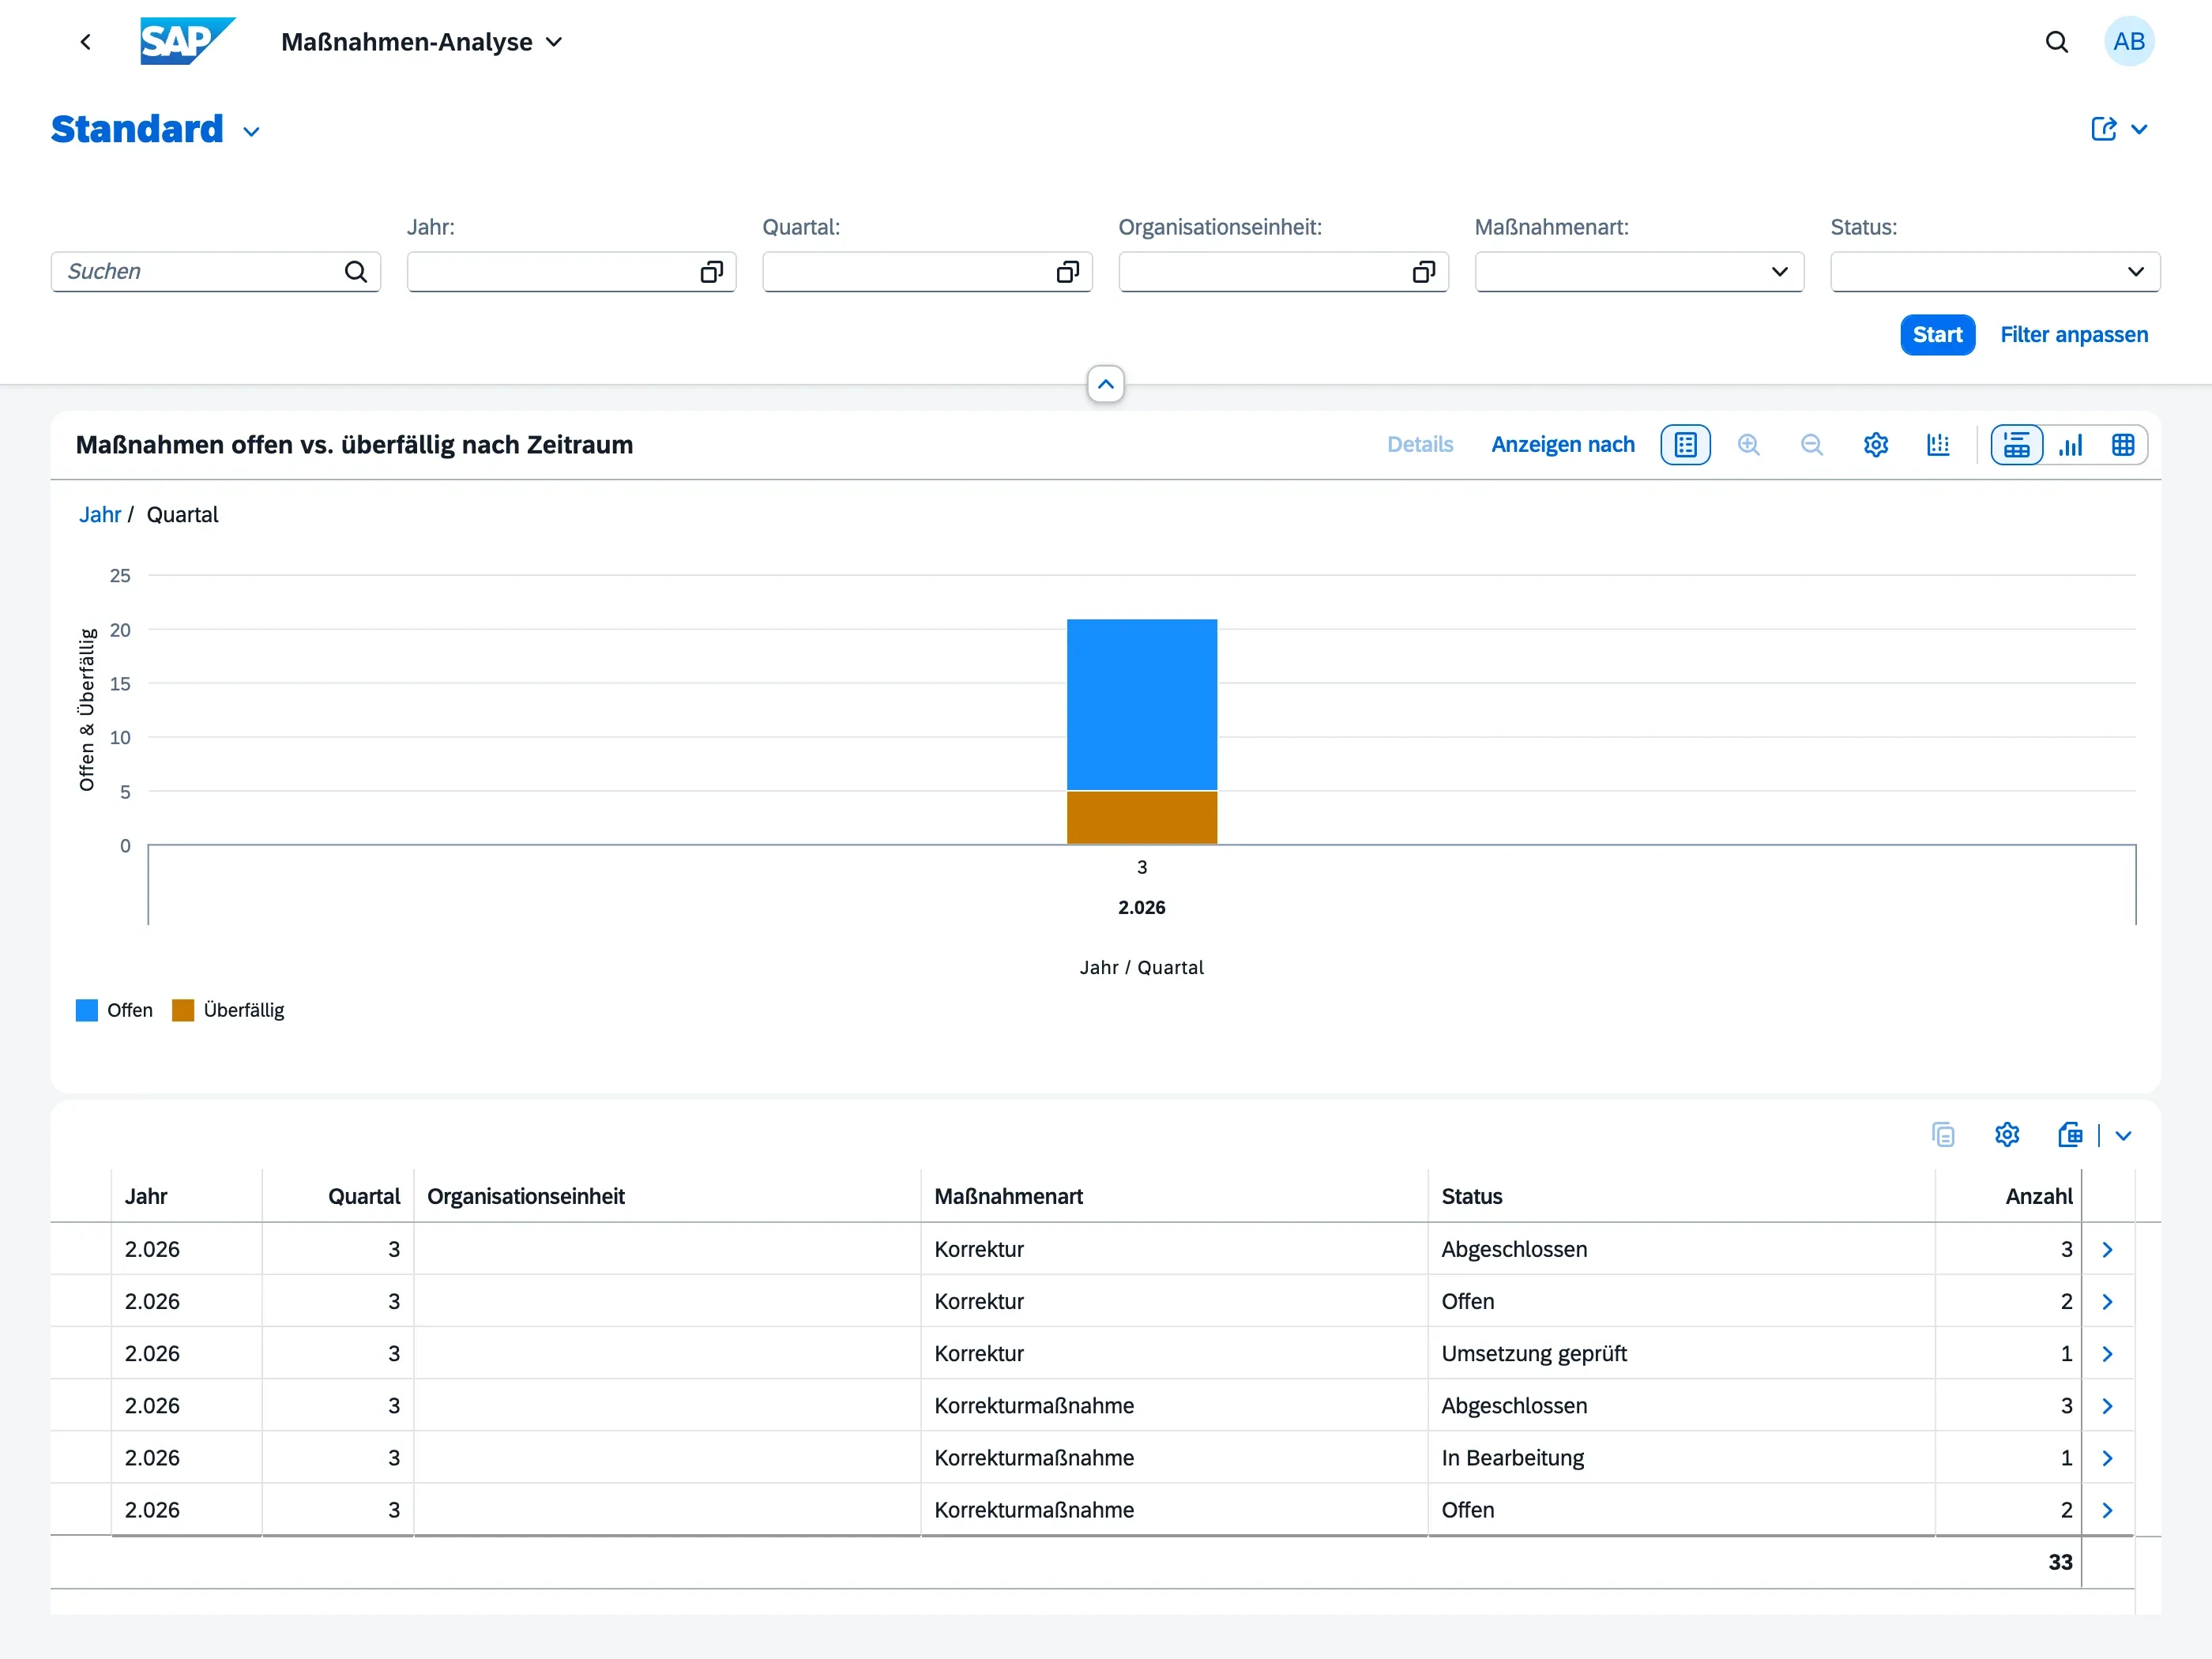
The Action Item Analytics dashboard gives Audit Managers a trend view of corrective and preventive actions across all audits — a chart of open versus overdue action items over time, plus a table you can drill into by organizational unit, action type, and status. It’s designed for management review meetings, complementing Findings Analytics with the action-tracking side of the picture: are action items being closed on time, and are corrective actions actually proving effective?
Who can use this
Section titled “Who can use this”- Audit Managers — full access to the dashboard
- Auditors and Auditees do not have access; this view is intended for management-level reporting
The dashboard is read-only — you cannot create, edit, or delete action items from here. To work with individual action items, use the Action Workbench or My Action Items.
What the chart shows
Section titled “What the chart shows”The chart plots the number of open action items against the number of overdue ones, by year and quarter. An action item counts as overdue once its due date has passed and it hasn’t reached a completed status yet — this matches the overdue indicator you see on individual action items elsewhere in the app.
The period shown is based on when the underlying audit was completed (or, for audits still in progress, when the action item was created).
Filtering the data
Section titled “Filtering the data”Use the filter bar above the chart to narrow the view down:
- Year and Quarter — limit the trend to a specific period
- Organizational Unit — focus on one part of the organization
- Action Type — show only a specific type (Correction, Corrective Action, or Preventive Action)
- Status — filter by lifecycle status (Open, In Progress, Verified, Effective, Closed, Cancelled)
Choose Go to apply your filters. Choose Adapt Filters to show or hide additional filter fields.
Using the table
Section titled “Using the table”Below the chart, a table lists the same action items broken down by year, quarter, organizational unit, action type, and status, with a count for each combination — plus two effectiveness columns:
- Effectiveness Reviews Eligible — the number of Corrective Actions in that group that have reached Closed or Effective, and are therefore due an effectiveness check
- Effectiveness Reviews Confirmed — how many of those have actually had their effectiveness confirmed
Comparing these two numbers across a filtered view tells you the effectiveness quote for the selected scope — for example, filtering to a single organizational unit shows you what share of its closed corrective actions were confirmed effective. Use View By above the chart to switch between chart types, or use the table’s own controls to change grouping and sort order.
For a deeper, effectiveness-only breakdown — including scheduled reviews and actions rated not effective — see Effectiveness Analytics. Action items created from a missed quality objective additionally show up as Open Action Items in the Quality Objective Cockpit.