

Quality Objective Cockpit
While the Quality Objectives app shows a single objective in detail, the Quality Objective Cockpit gives the overview across all objectives at once — one row per objective, sorted by criticality. It is built for the management review under ISO 9001, 9.3.2 c.4, where the question is not “how is this one objective doing” but “where does the organization stand overall”.
The cockpit is read-only — creating objectives, recording measurements, and evaluating still happen on the respective object page. Access is available to Quality Manager and Audit Manager; see Roles & Permissions. Unlike quality objectives themselves, which are part of every installation, the cockpit belongs to Reporting and requires the corresponding subscription — see Tenant Setup & Subscription.
Showing the key figures
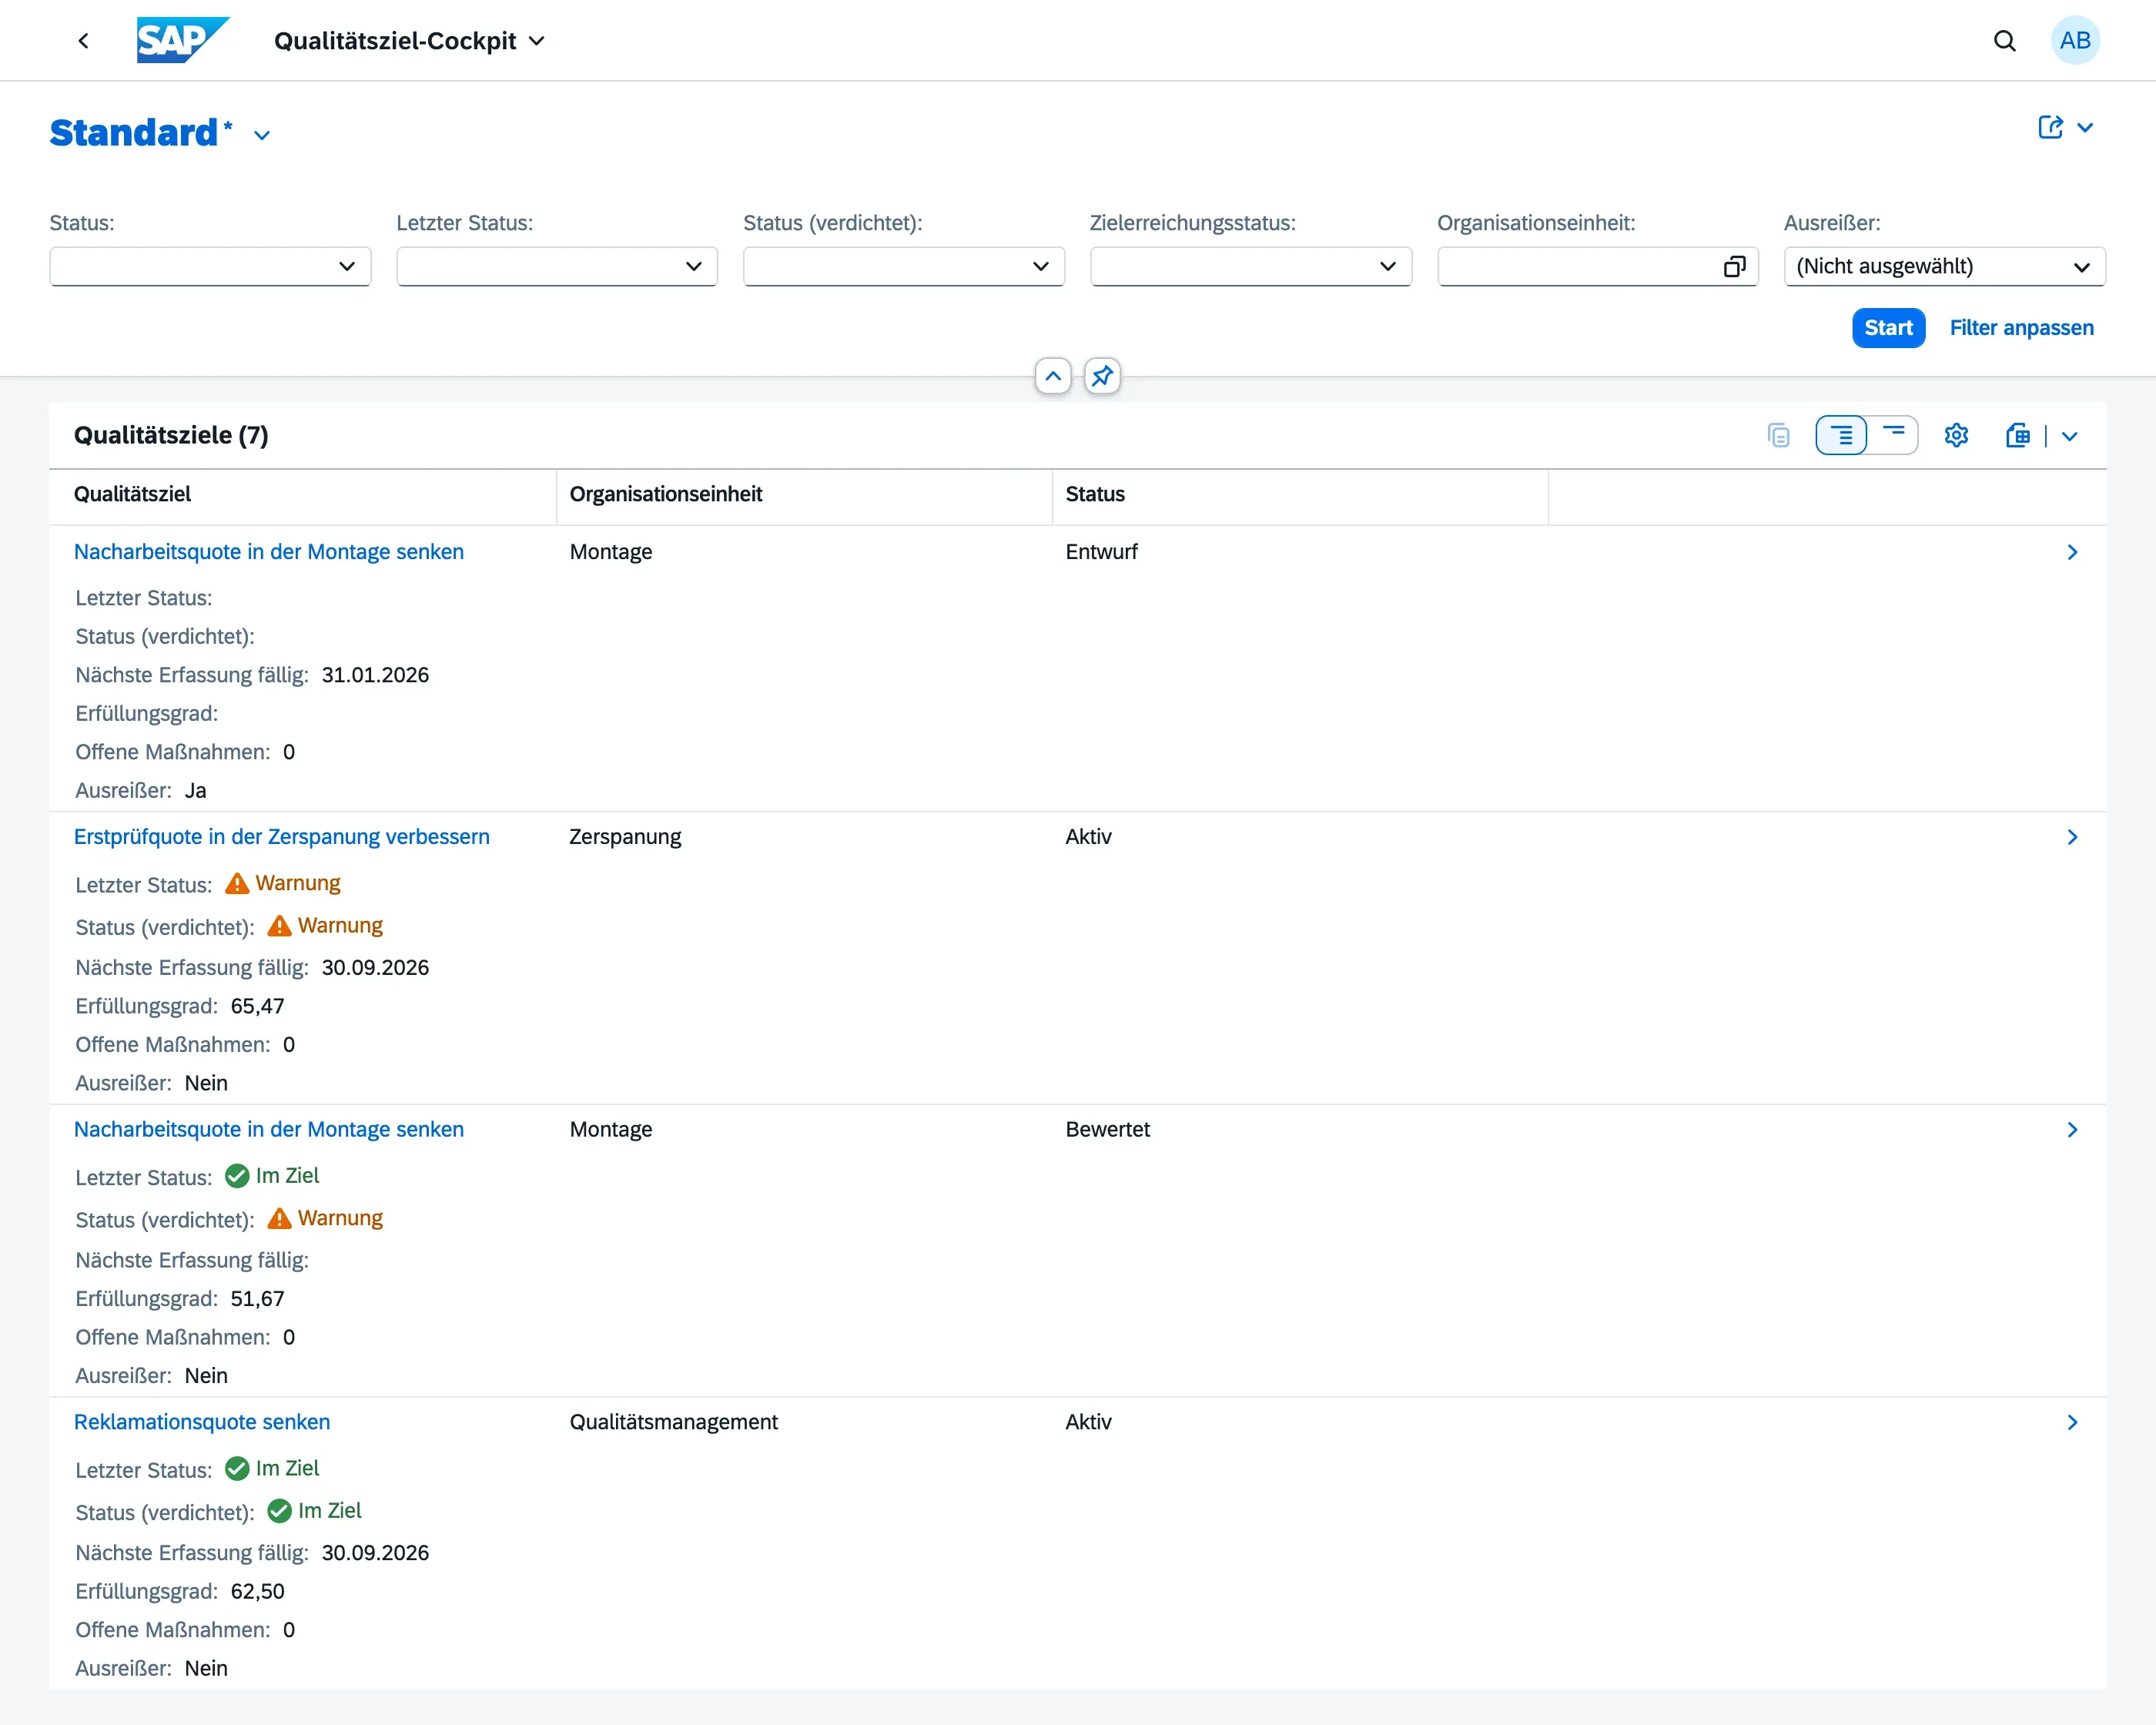
Section titled “Showing the key figures”When first opened, the cockpit shows only Quality Objective, Org Unit, and Status. The actual key figures appear once you switch to Show More per Row (Mehr je Zeile anzeigen) above the table on the right — they are then displayed as an additional row beneath each objective:
- Latest Status — the status of the most recent single measurement
- Aggregated Status — the status of the entire measurement series
- Next Measurement Due — the next open period
- Achievement — progress between baseline and target value, as a percentage
- Open Action Items — number of not-yet-completed action items linked to the objective
- Outlier — see below
An objective’s three statuses
Section titled “An objective’s three statuses”In the cockpit, an objective carries three distinct status values that are deliberately kept apart:
| Column | Meaning |
|---|---|
| Status | The objective’s own lifecycle status — Draft, Active, Evaluated, or Cancelled |
| Latest Status | The status of the most recent single measurement only |
| Aggregated Status | The status of the whole measurement series, condensed by the method configured on the objective (average, sum, last, or worst value) |
Latest and aggregated status deliberately do not always coincide. In the screenshot above, the evaluated rework objective shows exactly that case: Latest Status On Target, Aggregated Status Warning — the December value was on target, but the annual average was still in the warning band because the weaker months weigh it down. The cockpit shows both side by side on purpose: a single good month does not clear the alarm if the overall trend has not turned yet.
The achievement percentage next to them answers yet another question — how far the objective has come between baseline and target value. It can be low while the status band reads On Target; the two do not contradict each other but measure different things. The full explanation is on the Quality Objectives page.
Sorting
Section titled “Sorting”By default the most critical objective is on top: rows are sorted by the aggregated status band, with the achievement percentage breaking ties. Objectives without measurements — typically fresh drafts — have no derivable criticality and therefore also appear near the top even though they are not running yet. The status in the third column makes this recognisable.
Filtering
Section titled “Filtering”The filter bar allows narrowing by Status, Latest Status, Aggregated Status, Achievement Status, Org Unit, and Outlier. Choose Go (Start) to apply the filters — the table does not load on its own.
Outliers
Section titled “Outliers”An objective is flagged as an outlier when its most recent measurement shows Action Required, or when it has overdue periods with no recorded value. In a long list of objectives, the Outlier filter surfaces exactly those that need a closer look — without having to open each objective individually.
Both triggers are deliberately equal in weight: an objective nobody has recorded a value for in months needs just as much explaining in a management review as one that has breached its limit.
Navigating to an objective
Section titled “Navigating to an objective”Choose an objective’s title or the row arrow to jump straight to its object page — with the full target metric, the complete measurement series including notes, and the linked action items. See Quality Objectives.
Next steps
Section titled “Next steps”- Quality Objectives — create a single objective, record measurements, evaluate
- Roles & Permissions — who is allowed to do what across the system